A friend of mine recently said: “I want to invest in this ETF, but how do I work out if it’s good or not?”. Let’s unpack this question.
The four key characteristics to look out for in an ETF is:
- A history of performance
- Reasonable management fees
- Credible ETF issuer
- Sufficient fund size
Additionally, it is useful to look at the holdings of the ETF to see if what’s on the box is also inside.
For the purposes of illustration, I’ll be using the Vanguard Australian Shares Index ETF (ASX: VAS) ETF as an example.
If you want to jump straight into an ETF course that expands on this article in more detail, check out Rask’s Beginner ETF Investing Course. It’s completely free.
ETF Overview
An exchange traded fund (ETF) is a basket of securities (shares, property, bonds) held within a single fund.
The ETF is publicly traded, meaning units can be bought and sold freely on the Australian Stock Exchange (ASX) like shares in a company.
Each ETF tracks an underlying index, chosen by the ETF Issuer and charges a management fee for providing the ETF product.
1. Performance history
Often the first metric used to research ETFs, performance history shows the return per annum you would have received if you had invested at various time intervals.
Below is the performance history of VAS:
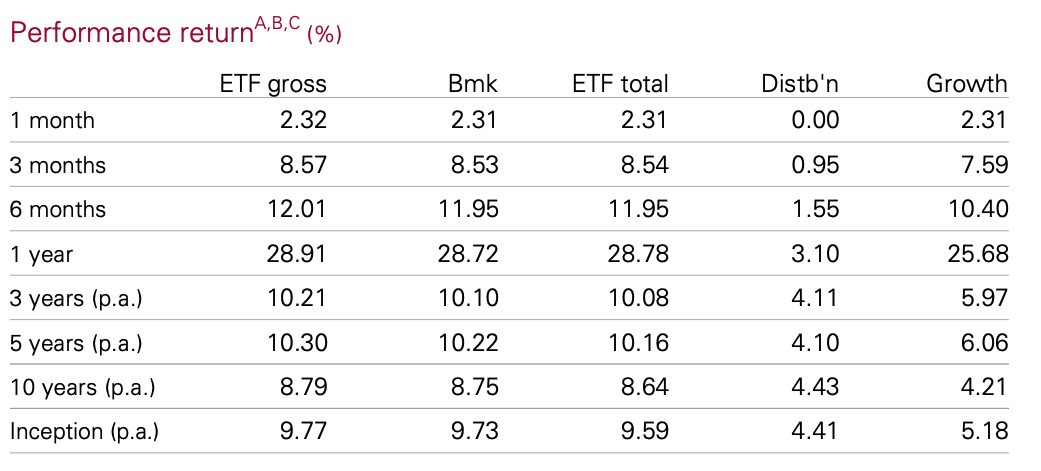
The performance table may look a little intimidating so let’s work through it.
ETF gross is the return of the ETF before fees.
Bmk stands for benchmark, which is the return of the underlying index.
ETF Total is the return of the ETF after fees. This is the performance you are interested in.
Distribution refers to the dividend portion of your ETF return.
Similarly, Growth refers to what amount of return was attributable to underlying companies share price increases. Distribution plus Growth equals ETF total return.
For reference, the average market return of the Australian market since 1900 is 6.6% per annum. The worlds largest share market, the United States has an average return since 1900 of 6.5%.
It should be noted that past performance is not an indicator of future performance. If an ETF has a one-year performance of 50%, it’s highly unlikely this will be replicated in future years.
You’re looking for sustained performance over a long duration – 5, 10 and 20 years. Not a short-term sugar hit.
Calculating return based on historical performance
To calculate what you return would be based on historical performance, the following formula is helpful:
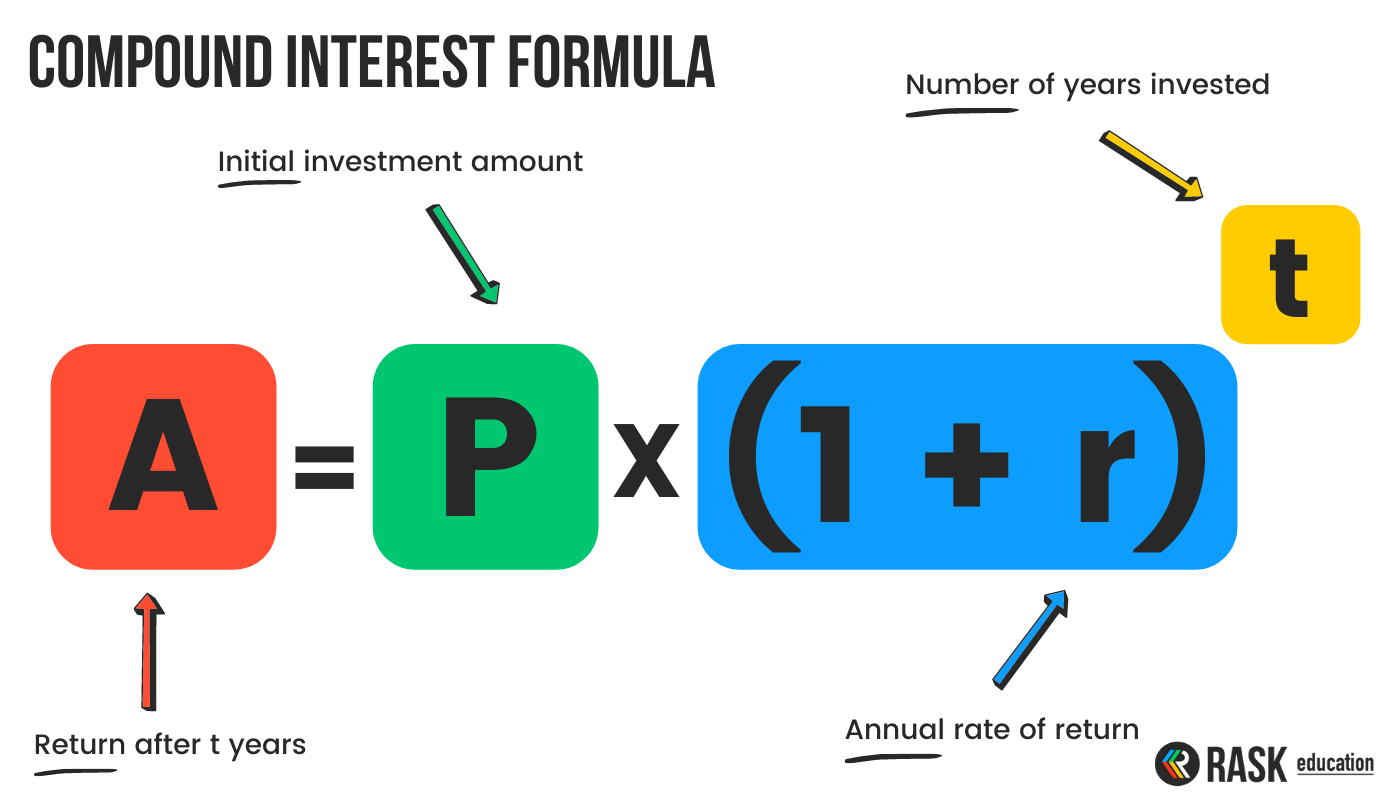
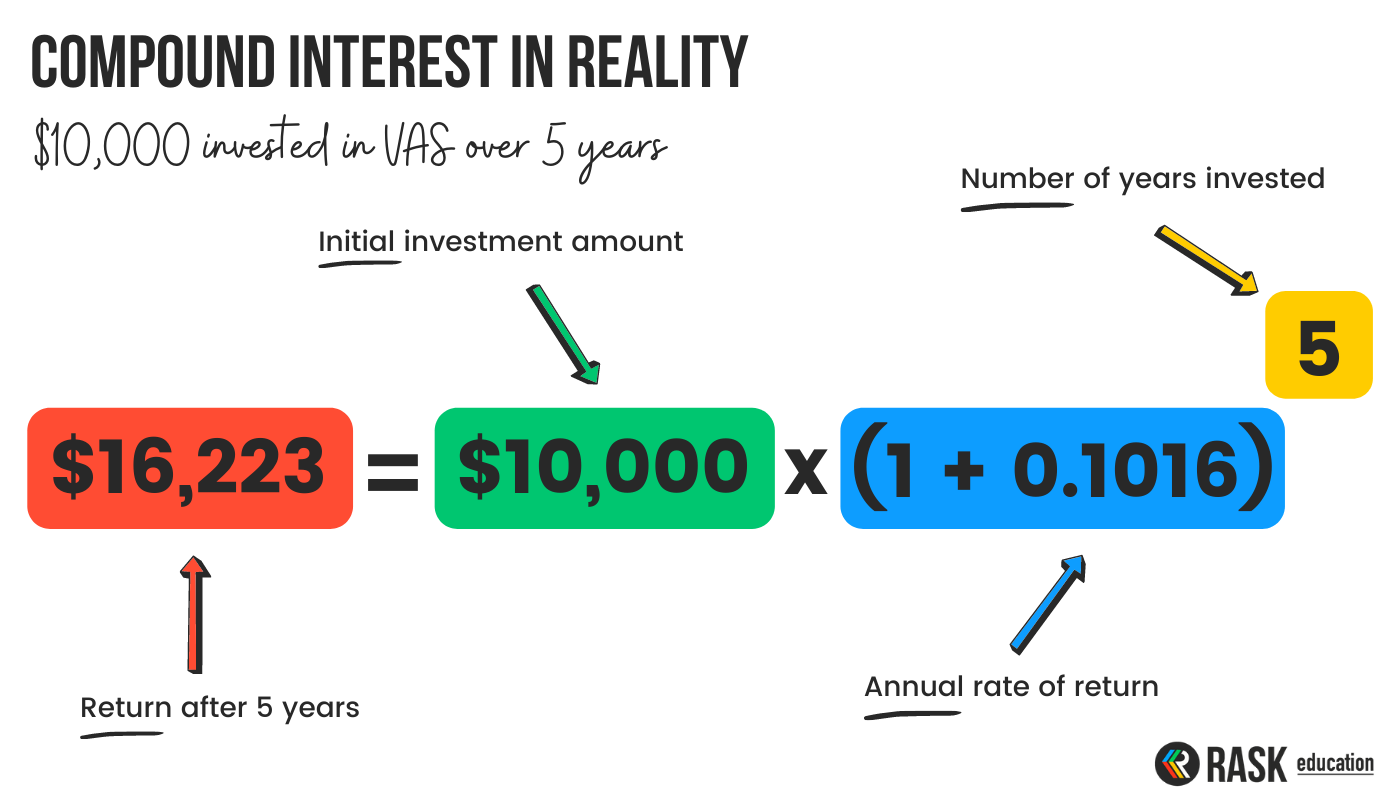
For example, VAS has a five-year annual return of 10.16%. If you invested $10,000 in VAS five years ago, your return would be $16,223.
Note the 10.16% converts to 0.1016 (move the decimal point two spots to the left).
2. Management fees and costs
Each ETF will charge a management fee for providing the ETF product. The fee pays for administration costs, holding statements, rebalancing the ETF and allowing you access to the basket of securities.
ETFs that track a broad index such as the S&P 500 or S&P/ASX 200 usually have low management fees. As the ETF product becomes more complex such as sector (banking, healthcare) or thematic (ethical, renewable energy, esports) specific, management fees will increase.
As a rule of thumb, I aim to pay around 0.10% per annum for broad index ETFs and no more than 0.60% per annum for thematic ETFs.
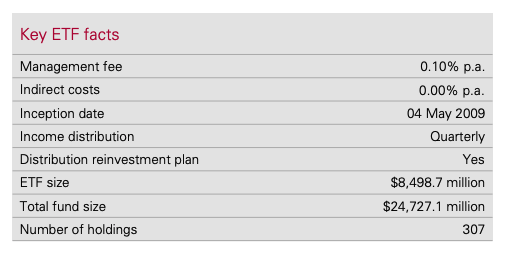
VAS tracks the 300 largest companies on the ASX, also known as the S&P/ASX 300 Index. Its management fee is 0.10% per annum with no indirect costs, so it gets my tick of approval.
Keep in mind you don’t pay directly for the ETF. Each day the ETF issuer will deduct a percentage of funds from the ETF and accumulate the management fee over the year.
In some cases, ETFs will charge additional indirect expenses to recoup any costs. These will be stated in the Product Disclosure Statement (PDS) or on the ETF fact sheet.
3. ETF Issuer
The demand for ETFs had led to new providers entering the market offering a range of products.
When looking for a credible ETF Issuer, check to see how long the provider has been offering ETFs and if it has a sound track record.
Additionally, look to see how much Funds Under Management (FUM) it manages. While not a perfect metric, larger issuers have the benefit of scale and can pass on this cost saving to you.
Vanguard has been creating and managing ETFs since 2001 and is the second largest ETF provider globally.
Notable ETF product providers in Australia include iShares, ETF Securities, Betashares, SPDR, VanEck and Vanguard.
4. Funds under management
High FUM indicates the ETF is popular with investors and reduces the risk of ETF liquidation (when the ETF issuer closes the ETF). Also as mentioned above, larger ETFs are able to pass on the cost savings to investors.
ETF issuers need to make a profit to be able to provide the products. My rule of thumb is at least $100 million in FUM.
VAS has approximately $8.5 billion in FUM making it the second largest ETF on the Australian market.
5. Holdings
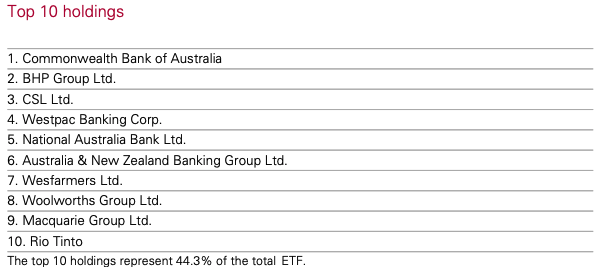
I find it useful to browse the holdings within the ETF to gain a better understanding of what’s actually inside. This ensures the name of the ETF corresponds with the underlying investments.
For example, VAS has large weightings to banks and financials in line with the broader Australian market.
If I don’t know a company, I’ll google to see what it does and how it aligns with the specific ETF. This is particularly useful when researching climate change or ethical ETFs.
Final comments
Hopefully, the criteria outlined above helps you (and my friend) in comparing ETFs. It’s by no means an extensive list but will get the ball rolling.
If you’re interested in learning more about ETFs, I highly recommend Rask’s Beginner ETF Investing Course. It’s completely free and only takes an hour to complete.
Happy ETF hunting!


